Best San Diego, CA Car Insurance in 2025
The average rates for car insurance in San Diego, CA, are $367.87/mo. California requires 15/30/5 in minimum liability coverage. Comparison shopping may save you up to 20%.
Free Car Insurance Comparison
Compare Quotes From Top Companies and Save
Secured with SHA-256 Encryption
Tracey L. Wells
Licensed Insurance Agent & Agency Owner
Tracey L. Wells is a licensed insurance agent and Farmers insurance agency owner with 23 years of experience. He is proud to be a local Farmers agent serving Grayson, Georgia and surrounding areas. With experience as both an underwriter and agent, he provides his customers with insight that others agents may not have. His agency offers all lines of insurance including home, life, auto, RV, busi...
Licensed Insurance Agent & Agency Owner
UPDATED: Jan 12, 2025
It’s all about you. We want to help you make the right coverage choices.
Advertiser Disclosure: We strive to help you make confident car insurance decisions. Comparison shopping should be easy. We are not affiliated with any one car insurance company and cannot guarantee quotes from any single company.
Our partnerships don’t influence our content. Our opinions are our own. To compare quotes from top car companies please enter your ZIP code above to use the free quote tool. The more quotes you compare, the more chances to save.
Editorial Guidelines: We are a free online resource for anyone interested in learning more about auto insurance. Our goal is to be an objective, third-party resource for everything auto insurance related. We update our site regularly, and all content is reviewed by auto insurance experts.
UPDATED: Jan 12, 2025
It’s all about you. We want to help you make the right coverage choices.
Advertiser Disclosure: We strive to help you make confident car insurance decisions. Comparison shopping should be easy. We are not affiliated with any one car insurance company and cannot guarantee quotes from any single company.
Our partnerships don’t influence our content. Our opinions are our own. To compare quotes from top car companies please enter your ZIP code above to use the free quote tool. The more quotes you compare, the more chances to save.
On This Page
San Diego Stats Summary
| San Diego, California Statistics | |
|---|---|
| City Population | 1,406,622 |
| City Density | 4,337 people per square mile |
| Average Cost of Insurance | $4,414.64 |
| Cheapest Car Insurance Company | Progressive |
| Road Conditions | Poor - 34% Mediocre - 30% Fair - 19% Good - 17% Vehicle Operating Costs - $694 |
It’s not difficult to imagine.
Driving along La Jolla’s breathtaking coastline. Hitting the streets of the historic Gaslamp Quarter. Cruising the highway alongside the towering mountains of Julian. Jumping in the car to dine in Little Italy. Or, having a beach day in Coronado.
For the motorist looking to take on the roads of San Diego, California, there is no shortage of sights or destinations. But for those looking to explore car insurance coverage in California’s second-largest city, they’ll also discover no shortage of options — to the point where choosing the right provider may seem daunting.
Here’s the thing — determining the right course of action for your car insurance involves much more than just your vehicle. What part of San Diego you live in, how many miles you drive, and whether you own a home can impact your rates.
But if you’re wondering where and how you can even begin to find all of this information, we have good news — it’s all in this guide.
Here, you’ll find everything you need to know about driving in San Diego, from cheap car insurance rates, to company-to-company comparisons, to average rates by driving record.
We’re also digging into San Diego’s economy, giving you a closer look at wages, employment, and higher education.
Finally, we’ve got the inside scoop on the city’s busiest highways, tolls, public transportation, crime, and parking.
The best part? This guide covers all of these topics…and so much more.
Navigating the streets of San Diego as an informed driver begins here. You can also compare rates by entering your zip code into our FREE car insurance comparison tool.
The Cost of Car Insurance in San Diego
We’re sure you’ve heard it before — there are a lot of factors that impact the cost of your car insurance, but what are the factors that affect car insurance rates? For drivers living in San Diego, this is no exception. For instance, the community you live in — whether that’s North Park, Mission Valley, or Miramar — can result in significantly higher or significantly lower rates.
You might find yourself asking how does my San Diego, CA stack up against other top metro auto insurance rates? We’ve got your answer below.
And of course, there’s always the company you choose to go with and what level of coverage you’re seeking for your car.
What you end up paying as a San Diego driver doesn’t have to remain a mystery. Let’s take a closer look at the cost of car insurance in San Diego, beginning with some basic demographics.
San Diego Rates by Age, Gender, & Marital Status
Male or female, single or married, young or old.
These states no longer using gender to calculate your auto insurance rates — Hawaii, Massachusetts, Michigan, Montana, North Carolina, and Pennsylvania. But age is still a significant factor because young drivers are often considered high-risk. California does use gender, so check out the average monthly auto insurance rates by age and gender in San Diego, CA.
Whether we like it or not, our demographics can have bearing on what we end up paying in premiums.
So what does that mean for drivers living in San Diego?
San Diego, CA auto insurance rates by company and age is an essential comparison because the top auto insurance company for one age group may not be the best company for another age group.
Rates by Age
First thing’s first — the median age in San Diego is 34.5. This is important, because 35-year-old drivers in San Diego are paying some of the lowest rates:
San Diego Rates by Age
| Age | Average Rate |
|---|---|
| 17 | $6,423.69 |
| 25 | $2,975.17 |
| 35 | $2,319.96 |
| 60 | $2,065.66 |
In examining our Quadrant data for San Diego, we see the obvious — premiums for teenage drivers are the highest, and by a longshot. Our calculations show that the rates for 17-year-old drivers are more than three times higher than their 60-year-old counterparts, and more than two times higher than those of 25- and 35-year-olds. But there are tips for finding car insurance for young drivers.
In the end, 60-year-old drivers have the lowest average premium on this list, at just over $2,000.
Rates by Gender (Male vs. Female)
The fact that your gender can play a role in what you pay in premiums is a commonly known fact in the car insurance industry.
We compared the average rates between male and female drivers in San Diego and found the difference to be minimal, with men paying $161 more in premiums:
San Diego Male v Female
| Gender | Average Rate |
|---|---|
| Male | $3,446.12 |
| Female | $3,284.95 |
But here’s what you need to know — in the state of California all of this is changing, and it’s all as a result of the Gender Non-Discrimination in Automobile Insurance Rating Regulation.
As of January 1, 2019, outgoing California Insurance Commissioner Dave Jones banned the use of gender in setting insurance rates for private passenger cars. In a press release, state officials go on to say
“the Commissioner’s Gender Non-Discrimination in Automobile Insurance Rating Regulation mandates that all automobile insurance companies operating in California file a revised class plan that eliminates the use of gender as a rating factor.”
Rates by Marital Status & Age
Finally, there’s the question of marital status. Who tends to pay less in car insurance premiums — single drivers or married drivers?
We combed the data for San Diego, and here’s what we found:
San Diego Age, Gender, Marital Status
| Age & Gender | Average Rate |
|---|---|
| Age: 60 female | $2,063.00 |
| Age: 60 male | $2,068.32 |
| Age: 35 male | $2,298.94 |
| Age: 35 female | $2,340.99 |
| Age: 25 female | $2,930.89 |
| Age: 25 male | $3,019.45 |
| Age: 17 female | $5,804.91 |
| Age: 17 male | $7,042.47 |
The verdict? San Diego residents who are married are paying lower rates across the board, particularly those in their 60s. And where the rates among single, 25-year-olds are either at or just below $3,000, the rates among single, 17-year-olds are exponentially higher than the rest. Single, 17-year-old males are paying rates more than three times that of married, 60-year-old females.
For more information, see the cost of married car insurance vs. single car insurance.
Cheapest Zip Codes in San Diego
Here’s a question: can your San Diego zip code make a difference in what you pay for your car insurance?
Check out the monthly San Diego, CA auto insurance rates by ZIP Code below:
The answer? Absolutely. According to Allstate,
“Where you live and where you park your car overnight may affect your car insurance premium. Urban neighborhoods typically have higher rates of accidents, theft and vandalism than more rural areas, which means premiums may be higher.”
We gathered the data for San Diego in the table below:
San Diego rates by Zip Code
| Zip Code | Average Rate |
|---|---|
| 92131 | $4,414.64 |
| 92128 | $4,414.71 |
| 92124 | $4,436.94 |
| 92119 | $4,437.27 |
| 92103 | $4,464.01 |
| 92129 | $4,492.82 |
| 92126 | $4,506.13 |
| 92116 | $4,512.63 |
| 92111 | $4,539.33 |
| 92120 | $4,540.05 |
| 92117 | $4,545.61 |
| 92130 | $4,556.94 |
| 92122 | $4,563.61 |
| 92127 | $4,586.43 |
| 92123 | $4,613.93 |
| 92014 | $4,624.73 |
| 92197 | $4,646.59 |
| 92199 | $4,646.59 |
| 92104 | $4,652.23 |
| 92139 | $4,662.57 |
| 92121 | $4,663.12 |
| 92107 | $4,664.32 |
| 92110 | $4,665.00 |
| 92154 | $4,700.45 |
| 92106 | $4,722.75 |
| 92109 | $4,727.26 |
| 92115 | $4,732.04 |
| 92108 | $4,781.74 |
| 92101 | $4,799.57 |
| 92182 | $4,832.37 |
| 92102 | $4,850.18 |
| 92114 | $4,888.27 |
| 92113 | $4,972.84 |
| 92105 | $5,128.60 |
| 92140 | $5,174.16 |
| 92134 | $5,291.04 |
| 92135 | $5,707.40 |
So, which San Diego zip codes are paying the highest in premiums? 92105 (which includes City Heights and Oak Park), 92140 (near the airport), 92134 (includes Inspiration Point North), and 92135 (at NAS North Island). In each of these zip codes, San Diego drivers’ rates range between $5,100 and $5,700.
As for the zip codes with the lowest rates? Those in the communities of Scripps Ranch (92131), Sabre Springs (92128), and Carmel Mountain Ranch (92128) have nearly the same rates, at just over $4,414.
What’s the best car insurance company in San Diego?
Let’s be honest — trying to determine “the best” car insurance company in San Diego will be pretty subjective from driver to driver.
Which San Diego, CA auto insurance company has the cheapest rates? And how do those rates compare against the average California auto insurance company rates? We’ve got the answers below.
But one thing we do know is that cost will play a major determining factor, if not the top factor, for most.
Cheapest Car Insurance Rates by Company
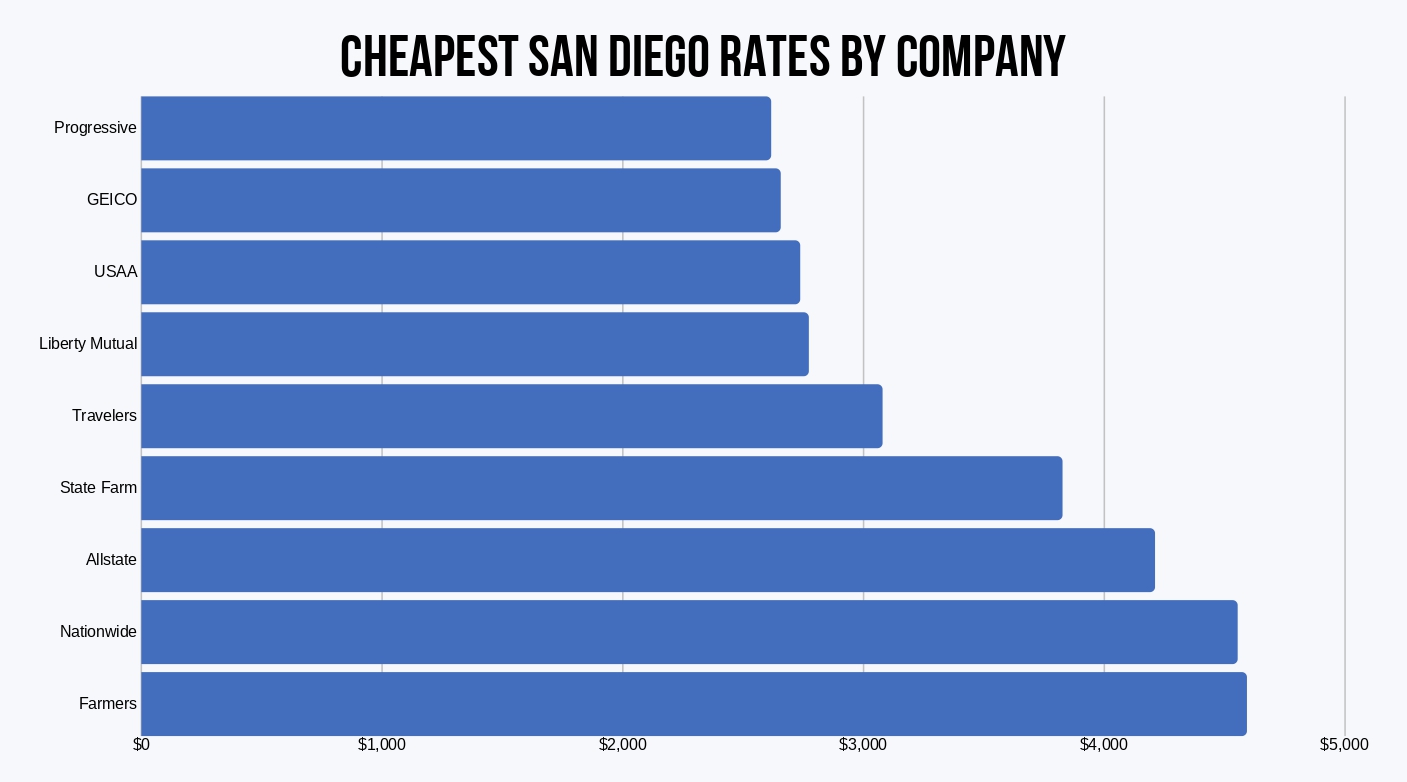
Let’s begin with a look at the average overall rates of San Diego’s top providers:
According to these numbers, San Diego drivers with Progressive car insurance are paying some of the lowest rates, at just over $2,600. As for the highest rates? That distinction goes to Farmers car insurance customers, with an average rate of $4,589.23.
Remember — there is always room for fluctuation, as driver-to-driver rates will vary depending upon several factors.
Best Car Insurance for San Diego Commute Rates
Here’s an interesting fact — the average California resident drives 13,414 miles a year. And people may wonder how does mileage affect my car insurance?
Factor in that type of mileage into their car insurance and San Diego drivers can expect to see a difference in their rates, depending on their provider.
With 4,200 square miles of land, San Diego drivers have a lot of ground to cover in their commutes. We took a look at what drivers with 10-mile daily commutes (6,000 miles annually) and 25-mile daily commutes (12,000 miles annually) are paying:
San Diego Rates by Commute
| Insurance Company | 10-mile commute/ 6000 annual mileage | 25-mile commute/ 12000 annual mileage | Average |
|---|---|---|---|
| $2,370.27 | $2,855.75 | $2,613.01 | |
| $2,409.58 | $2,895.85 | $2,652.72 | |
| $2,520.38 | $2,946.91 | $2,733.65 | |
 | $2,543.75 | $2,995.16 | $2,769.46 |
| $2,769.87 | $3,381.52 | $3,075.70 | |
| $3,682.99 | $3,963.39 | $3,823.19 | |
| $3,792.35 | $4,622.54 | $4,207.45 | |
 | $4,018.15 | $5,083.25 | $4,550.70 |
| $4,163.69 | $5,014.77 | $4,589.23 |
Our analysis found that no matter what provider San Diego drivers have, they’re paying more for longer commutes. The question then becomes, by how much?
- The biggest difference in rates can be seen among Nationwide customers. Drivers with longer commutes are paying about $1,000 more than their counterparts with shorter commutes.
- The smallest difference can be seen among State Farm customers, with a difference of roughly $280 between 10-mile and 25-mile daily commutes.
Best Car Insurance by Coverage Level Rates
We think it’s a no-brainer — drivers with higher coverage levels will pay higher rates, and drivers with lower coverage levels will pay lower rates. So, what does that look like for the average San Diego driver?
San Diego Rates by Coverage Level
| Insurance Company | High | Medium | Low | Average |
|---|---|---|---|---|
| $2,807.16 | $2,694.45 | $2,337.42 | $2,613.01 | |
| $2,874.18 | $2,684.11 | $2,399.86 | $2,652.72 | |
| $2,929.31 | $2,785.68 | $2,485.94 | $2,733.64 | |
 | $2,937.23 | $2,795.00 | $2,576.13 | $2,769.45 |
| $3,390.88 | $3,163.22 | $2,672.98 | $3,075.69 | |
| $4,152.88 | $3,892.90 | $3,423.80 | $3,823.19 | |
| $4,388.30 | $4,242.96 | $3,991.08 | $4,207.45 | |
 | $4,928.98 | $4,633.65 | $4,089.47 | $4,550.70 |
| $4,879.05 | $4,625.46 | $4,263.17 | $4,589.23 |
Your coverage level will play a major role in your San Diego auto insurance rates. Find the cheapest San Diego, CA auto insurance rates by coverage level below:
San Diego drivers who prefer to have the highest levels of coverage are averaging their highest rates with Nationwide , at just over $4,900.
On the flip side, San Diego drivers who prefer to have the lowest levels of coverage are paying the least amount with Progressive, at just over $2,300.
As for the provider with the lowest coverage rates across the board? That would be Progressive, which averages out at about $2,600. Farmers, on the other hand, has the highest average across all coverage levels, at $4,589.23.
Best Car Insurance Rates by Credit History Rates
Here’s another question — what do landlords, mortgage lenders, and insurance companies have in common?
They all look to your credit score as a means of determining risk.
But in the state of California, this practice is prohibited. According to the Insurance Information Institute:
“Most states generally permit using insurance scoring as a factor for determining premiums in personal lines. However…in California the use of credit is not permitted under Proposition 103 for rating auto insurance policies unless specifically allowed by the regulator.”
Best Car Insurance Rates by Driving Record
Crashes, traffic violations, and DUIs — whatever the infraction, you can pretty much guarantee that it will impact your car insurance premiums.
Your driving record will play a major role in your San Diego auto insurance rates. For example, other factors aside, a San Diego, CA DUI may increase your auto insurance rates 40 to 50 percent. See best car insurance for drivers with a DUI. Find the cheapest San Diego, CA auto insurance rates by driving record.
The experts at Investopedia say that, in the eyes of most car insurance companies, past infractions are an indicator of the type of issues drivers will have in the future. Drivers with worse records will be charged with an increased rate to compensate for the probability that the provider will need to pay out in claims on their behalf.
We looked into what San Diego drivers with clean records are paying in comparison to those who have had one speeding ticket, one accident, or one DUI:
San Diego Rates by Driving Record
| Insurance Company | Clean record | With 1 Speeding Violation | With 1 Accident | With 1 DUI | Average |
|---|---|---|---|---|---|
| $1,712.79 | $2,466.74 | $2,908.18 | $3,364.32 | $2,661.76 | |
| $1,854.08 | $2,299.98 | $2,865.72 | $3,591.07 | $2,770.29 | |
 | $2,403.42 | $2,547.03 | $3,220.38 | $2,906.98 | $2,843.59 |
| $1,815.82 | $1,989.36 | $2,704.92 | $4,424.47 | $2,981.74 | |
| $2,062.28 | $3,023.29 | $3,340.06 | $3,877.15 | $3,093.16 | |
| $2,728.39 | $3,166.31 | $3,253.90 | $6,144.15 | $4,042.15 | |
| $2,536.38 | $3,329.16 | $4,266.25 | $6,698.01 | $4,500.21 | |
| $3,396.22 | $4,587.15 | $4,621.10 | $5,752.44 | $4,589.92 | |
 | $3,176.14 | $4,071.25 | $4,071.25 | $6,884.15 | $4,710.51 |
In reading this table from left to right, we can see a steady increase in rates as we progress from a clean record to a DUI — that is, with the exception of one provider. Liberty Mutual drivers with one accident are paying higher rates than those who have had one DUI.
When it comes to drivers who have had one DUI, Allstate, State Farm, and Nationwide customers are paying the highest rates, all at over $6,000.
When it comes to drivers with clean records, customers with Progressive, Geico, and USAA are paying the lowest rates.
Car Insurance Factors in San Diego
Fact — in the world of car insurance rates, it’s not just about you. It’s also about your city and how well it’s doing.
So what are the factors that affect car insurance rates? Factors affecting auto insurance rates in San Diego, CA may include your commute, coverage level, tickets, DUIs, and credit. Controlling these factors will help you maintain cheap San Diego, California auto insurance.
In terms of San Diego and its economy:
- More than 120 San Diego companies made Inc. 5000’s list of fastest-growing companies in 2018, with San Diego’s Scientist.com cracking the top 10.
- Unemployment has been at record lows, but in some cases, wages have struggled to keep up with growth.
- Between June 2018 and June 2019, total nonfarm employment increased from 1,491,600 to 1,517,600, adding 25,700 jobs.
San Diego Growth & Prosperity
Let’s take a closer look at San Diego’s growth and prosperity, according to the Brookings Institution.
Experts say “growth indicators measure change in the size of a metropolitan area economy and its level of entrepreneurial activity. Growth and entrepreneurship create new opportunities for individuals and can help a metropolitan economy become more efficient.”
What kind of growth is the city of San Diego experiencing?
- San Diego’s overall rank in growth is 33rd out of 100
-
Jobs are up 7.1 percent (42nd of 100)
-
The gross metropolitan product (GMP) is up 14.3 percent (32nd of 100)
-
Jobs at young firms are down 12.9 percent (39th of 100)
When it comes to prosperity, experts with the Brookings Institution say:
“Prosperity captures changes in the average wealth and income produced by an economy. When a metropolitan area grows by increasing the productivity of its workers, through innovation or by upgrading workers’ skills, for example, the value of those workers’ labor rises. As the value of labor rises, so can wages. Increases in productivity and wages are what ultimately improve living standards for workers and families and the competitiveness of metropolitan economies.”
-
San Diego’s overall rank in prosperity is 25th out of 100
-
Productivity is up 6.7 percent (25th of 100)
-
The standard of living is up 1.8 percent (52nd of 100)
-
The average annual wage is up 11.1 percent (19th of 100)
Median Household Income
Knowing the median household income in San Diego allows us to do two things — gain more insight into the local economy, and determine what share of a typical resident’s income is going toward car insurance.
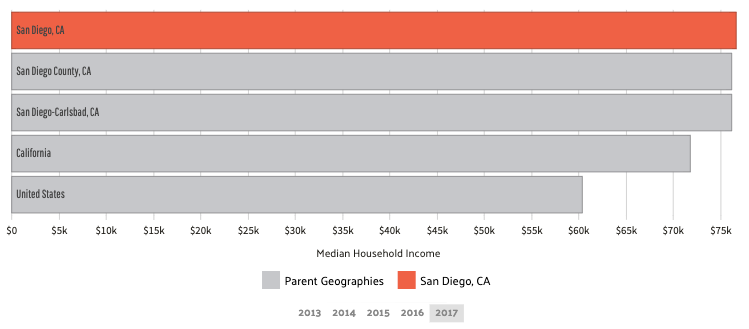
According to Data USA, households in San Diego had a median annual income of $76,662 in 2017. This was more than the average U.S. median annual income of $60,336. What’s more, San Diego’s median income grew from $71,481 in 2016, which is a 7.25 percent increase.
Take a look at the chart below comparing the city of San Diego (in orange) with the county, metropolitan area, state, and country:
Using the median income of $76,662 and an average car insurance premium of $4,414.64, we can conclude that 5.76 percent of the typical San Diego driver’s income is going toward car insurance. Want to know how much of your income is going toward your premium? Simply enter your data in the free Calculator Pro tool below:
CalculatorPro
Homeownership in San Diego
To own, or not to own?
In the city of San Diego, it appears for the majority the answer is not to own.
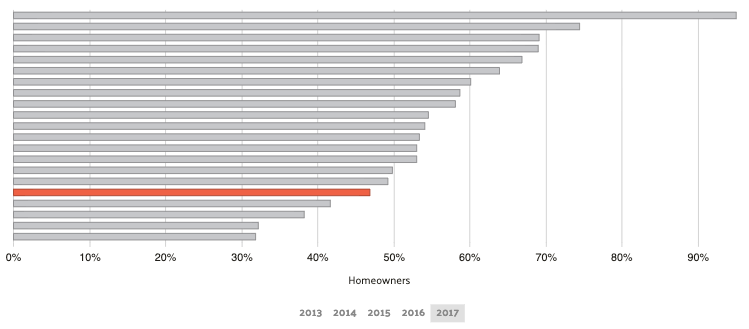
Statistics show that homeownership in San Diego was at 47.1 percent in 2017. This is up from 45.7 percent in 2016. For drivers, these figures become more intriguing because many car insurance companies offer discounted rates for bundling policies for auto and home insurance, as they are viewed as being more stable.
It’s also important to note that San Diego’s percentage of homeownership is lower than the national average of 63.9 percent. The graph below compares homeownership in San Diego (in orange) to other California cities, as well as the national average:
In terms of property value, Data USA reports the median property value in San Diego grew to $600,300 from the previous year’s value of $567,400. This is significantly higher than the average median property value in the U.S., at $193,500.
Education in San Diego
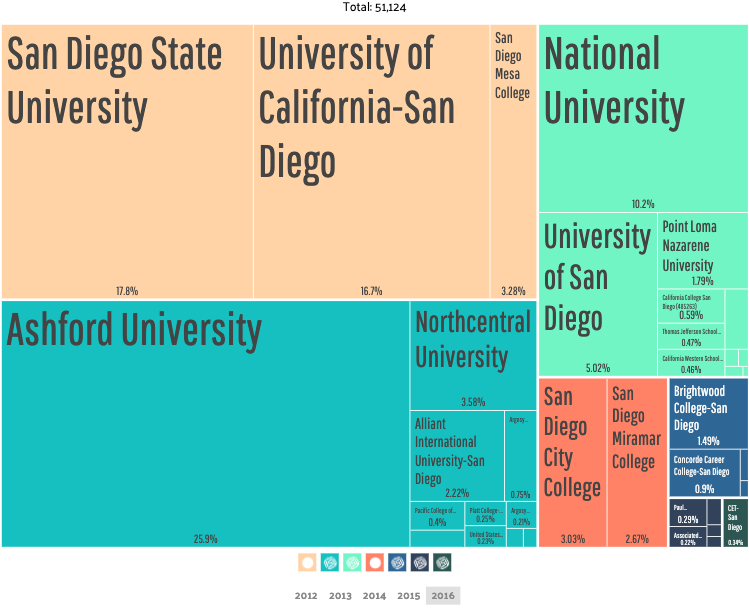
The opportunities for higher education in San Diego are vast. The city is home to more than 50 higher-learning institutions, and according to City-Data.com, San Diego has three major universities — San Diego State University (SDSU), the University of California at San Diego (UCSD), and the University of San Diego (USD).
We wanted to know which universities awarded the most degrees in San Diego. Here are the top three (also illustrated in the image below):
- Ashford University with 13,260 degrees awarded
- San Diego State University with 9,079 degrees awarded
- University of California, San Diego with 8,531 degrees awarded
San Diego is also home to several community colleges:
- San Diego Community College District
- Grossmont College
- MiraCosta College
- Palomar Community College
- San Diego City College
- San Diego Mesa College
- San Diego Miramar College
- Southwestern College
Wage by Race & Ethnicity in Common Jobs
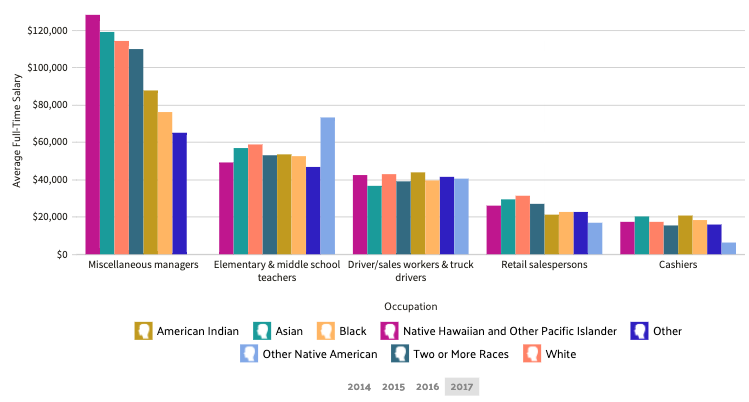
San Diego residents can learn a lot about their community by taking a closer look at what income workers are earning, particularly based upon race and ethnicity. While we could not find this data specific to San Diego, here’s what we found for the state of California:
In 2017, the highest paid race/ethnicity of workers were Asian. At an average salary of $69,782, they were paid 1.11 times more than White workers, who had the second-highest salary at $63,110.
The table below illustrates the average salaries among various races and ethnicities and across various industries:
We wanted to take this data a step further and see what percentage of these workers’ income is going toward their car insurance. We looked at the largest group of workers, categorized as “Miscellaneous Managers,” and compared their respective salaries against an average premium of $4,414.64:
San Diego Miscellaneous Managers Percentage of Income toward insurance
| Race or Ethnicity | Average Salary | Percentage of Income Going Toward Insurance |
|---|---|---|
| Native Hawaiian and other Pacific Islander | $128,245.00 | 3.44% |
| Asian | $118,884.00 | 3.71% |
| White | $114,429 | 5.05% |
| Two or More Races | $110,079.00 | 4.01% |
| American Indian | $87,447.00 | 5.05% |
| Black | $76,262.00 | 5.79% |
| Other | $65,067.00 | 6.78% |
Based on this data, Native Hawaiians and other Pacific Islanders are paying the smallest percentage of their income toward car insurance, at 3.44 percent. Those paying the largest percentage are categorized as “other” at 6.78 percent, followed by Blacks at 5.79 percent.
Wage by Gender in Common Jobs
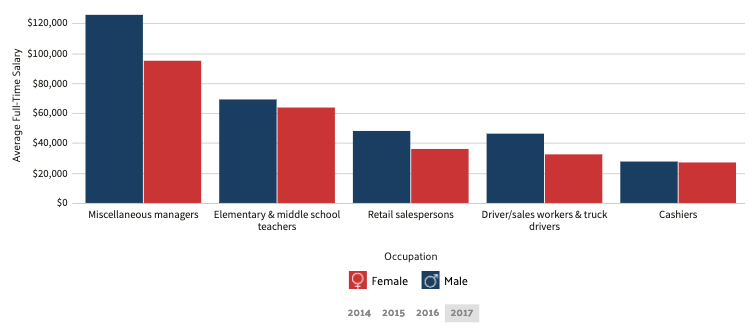
We also compared wages across gender and common jobs. Once more, this data was not available at the local level, only the state level. That being said, the average salary for Californian men in 2017 was $75,050, compared to $59,658 for women.
The table below breaks down average salaries between Californian men and women across various industries. Here, it’s obvious that males are making more than their female counterparts across the board — with the biggest difference seen among miscellaneous managers, and the smallest difference seen among cashiers.
We took the average salaries among men and women categorized as “miscellaneous managers,” and calculated what percentage of their income is going toward car insurance:
San Diego Wage by Gender
| Gender | Average Salary | Percentage of Income Going Toward Insurance |
|---|---|---|
| Male | $125,706 | 3.51% |
| Female | $94,699.00 | 4.66% |
Here, we can see that even at a lower average annual salary, women in California are paying a higher percentage of their income toward car insurance.
Poverty by Age & Gender
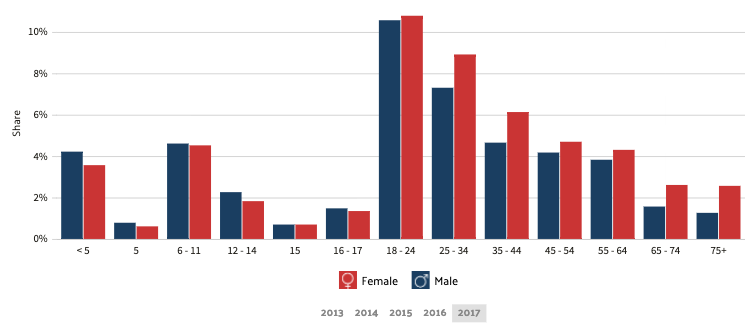
In spite of San Diego’s booming economy, Data USA reports that as of 2017, the percentage of people living in poverty in the city is higher than the national average.
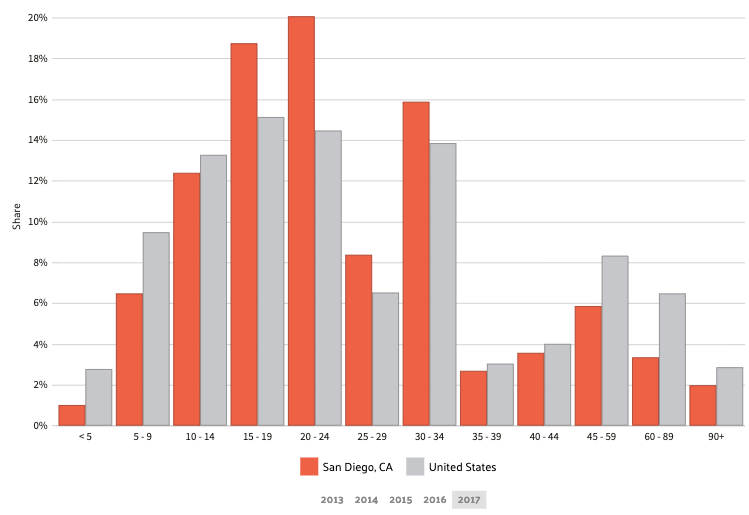
Statistics point to 14.5 percent of the population living below the poverty line (approximately 197,000 people), compared to the national average of 13.4 percent. The demographic most prevalent in this group are females ages 18 – 24 (a 10.8 percent share), followed by men ages 18 – 24 (a 10.6 percent share). The graph below gives a greater breakdown among more age groups:
Poverty by Race &Ethnicity
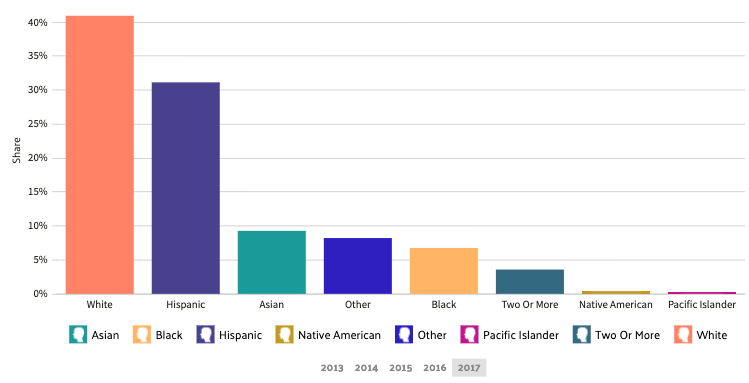
As we dig even deeper into this data, we can see which racial and ethnic groups in San Diego are experiencing the most poverty.
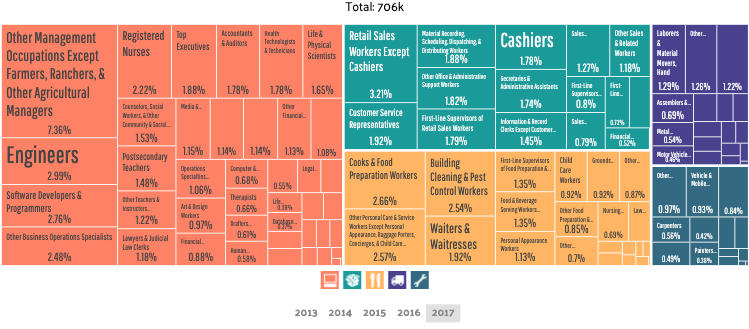
Employment by Occupations
Curious to know what are the most commonly held jobs in San Diego? According to Data USA:
- The highest number of people (52,015) are working in Management Occupations (excluding farmers, ranchers, and other agricultural managers)
- 22,654 people are working as Retail Sales Workers (but not as cashiers)
- 21,135 people are working as Engineers.
Free Car Insurance Comparison
Enter your ZIP code below to view companies that have cheap car insurance rates.
Secured with SHA-256 Encryption
Driving in San Diego
Admit it — you want to know what driving in San Diego is really like. Is it bumper-to-bumper traffic? Roads that are in disrepair? And what about tolls, public transit, and parking?
While getting a rundown of all of these conditions may seem nearly impossible, you’re in luck. We’ve gathered all of the details to give you a fuller picture of what it’s like to drive in San Diego.
Roads in San Diego
Given the size of the city, it’s hard to picture San Diego without any major highways and thoroughfares. But what you may not know is whether these roads are tolled, have red-light cameras, or are in good condition. Let’s dig into each topic:
Major Highways
According to the Interstate Guide, California is home to 12 active routes, making up over 2,400 miles of roadway.
This, of course, begs the question — how many of those interstates are in San Diego?
The answer? Four. Interstates 5, 15, 805, and 8 can all be found in San Diego. (This, of course, does not include a larger number of State Roads that can also be found in the city).
Interstate 5 spans the West Coast, beginning in San Diego and ending in Blaine, Washington.
https://www.youtube.com/watch?v=nqrpYpi-SYg
Interstate 805, also known as the Jacob Dekema Freeway, connects the border zone with the homes of Eastlake and Sorrento Valley.
Interstate 8 connects drivers from San Diego to Casa Grande, Arizona.
Finally, there’s Interstate 15, which spans as far north as Canada and as far south as Mexico.
What probably does not come as a surprise is that there are toll roads in San Diego. They can be found on Interstate 15 and the Southbay Expressway.
- For the I-15 Express Lanes, tolls range from 50 cents to a maximum of $8. Tolls are calculated based on the number of miles you travel and the congestion in the Express Lanes at the time of entry.
- For the Southbay Expressway, tolls vary depending on distance and whether or not a FasTrak account is being used
Speaking of FasTrack, drivers can open up an account and purchase a transponder to avoid having to stop and pay. To learn more about opening an account, visit the FasTrack San Diego Region website.
Popular Road Trips and Sites
Let’s be honest — finding something fun to do in San Diego shouldn’t be difficult. After all, in a city widely known for its stunning beaches, vibrant nightlife, and popular tourist destinations, the options are plentiful.
To name some fun destinations found on Only in Your State:
- Iron Mountain — one of the most popular places to hike in the county
- Balboa Park — home to more than 16 museums, as well as numerous gardens and trails
- The Geisel Library at UC San Diego — a library with unique architecture, found at UC San Diego
And, here are some more sites named on City-Data.com:
- The San Diego Zoo — one of the largest, and most famous, zoos in the world
- Sea World — the popular aquatic theme park
- Hotel del Coronado — one of the most iconic, beachfront hotels in the world
Finally, you can check out this Expedia Travel Guide video for more inspiration:
Road Conditions
Potholes, dips, and bumps — in just what condition are San Diego’s roads? And in what ways are drivers paying the price?
We turned to TRIP, a national transportation research group, and its 2018 Urban Roads Report. Here’s how the group breaks down San Diego’s roads:
- 34 percent of the roads are in “poor” shape
- 30 percent are considered “mediocre”
- 19 percent are in “fair” condition
- 17 percent are in “good” condition
- Estimated Vehicle Operating Costs run at $694
In doing a simple internet search, we found several San Diego news outlets allude to a national study claiming San Diego’s roads are costing taxpayers thousands annually in city upkeep and repair.
San Diego Speeding and Red Light Cameras
In the city of San Diego, Red Light Cameras are a thing of the past.
In 2013, then-Mayor Bob Filner ended the city’s Red Light Photo Enforcement Program, instead emphasizing police patrols.
Vehicles in San Diego
If you’re reading through this San Diego car insurance guide, chances are good that you own a vehicle.
When it comes to vehicle ownership in San Diego, some key factors to examine include the city’s most popular cars, the city’s most stolen cars, and the city’s overall crime rates.
Most Popular Vehicles Owned
According to YourMechanic, sedans from Honda, Toyota, Ford, and Chevrolet tend to be the most popular vehicles across the country. But in a Southern California city like San Diego, one might begin to picture sleek convertibles or sports cars as being the top vehicles of choice.
However, that isn’t the case.
YourMechanic’s list of the most popular cars per city reveals that in San Diego, Toyota pickups are number one. See some online Toyota Tacoma insurance rates.
A popular Toyota pickup truck can be found in the Tacoma.
- In terms of safety, the Insurance Institute for Highway Safety (IIHS) gives the 2019 Toyota Tacoma Small Pickup/Crew Cab Pickup some of its highest rankings in crashworthiness, superior rankings in front-crash prevention, and lower rankings in its child seat anchors (see the full review here).
- In terms of fuel economy, Toyota Tacomas range from 18 – 21 miles per gallon (combined city and highway), depending on its size and engine.
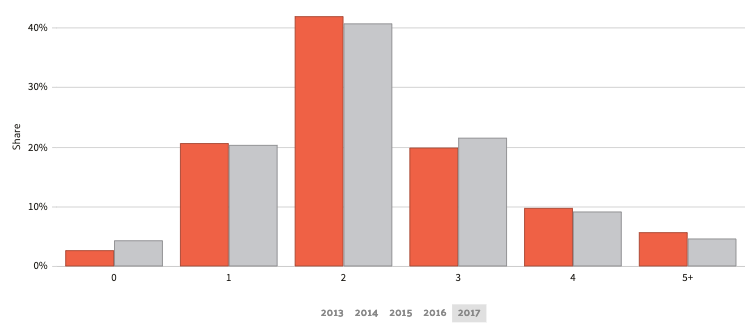
Number of Cars per Household
Data shows that the average number of cars found in a typical San Diego household is two. In fact, the occurrence of two cars per household is more prevalent in San Diego (at a 41.9 percent share) than it is at the national level (40.5 percent).
Households Without a Car
On the flip side, our data shows a very small percentage of San Diego households without a car. In fact, from 2015 to 2016, that percentage went down from 6.6 to 6.3 percent, with the number of vehicles per household increasing:
San Diego Households without Vehicles
| Year | Percentage of Households Without Vehicles | Vehicles Per Household |
|---|---|---|
| 2016 | 6.30% | 1.8 |
| 2015 | 6.60% | 1.76 |
Speed Traps in San Diego
If there’s one thing any driver despises, it’s a speed trap. And, if you’re like most drivers, you’d like to know where they’re located.
That’s where the National Motorists Association comes in, with Speedtrap.org. In listing California’s Top 10 Worst Speed Trap Cities, Santee — a suburb of San Diego — comes in at number one, with five listed speed traps at a 100 percent acknowledgment rate.
Vehicle Theft in San Diego
One minute it’s here, and the next, it’s gone.
Undoubtedly, there are few things scarier than realizing you’ve become a victim of vehicle theft.
The truth of the matter is, some vehicles are targeted more frequently than others. What part of town you’re in and where your car is parked can also play a significant role.
We did some digging and discovered that when it comes to vehicle theft in the state of California, the FBI ranks San Diego as the fourth-highest in the state, with 6,143 vehicles stolen. San Diego is surpassed only by Los Angeles, San Jose, and Oakland. See where California as a state stacks up against 15 states with the highest vehicle theft rates.
We also discovered that the San Diego County District Attorney regularly compiles lists of the top stolen vehicles. Here’s the county’s list from 2017:
San Diego Top Stolen Cars
| Rank | Autos | Personal Trucks |
|---|---|---|
| 1 | 2000 Honda Civic | 1997 Nissan PK |
| 2 | 1998 Honda Civic | 2001 Honda CRV |
| 3 | 1997 Honda Civic | 2004 Toyota Tacoma |
| 4 | 1996 Honda Accord | 2014 Jeep Wrangler |
| 5 | 1997 Honda Accord | 1999 Honda CRV |
| 6 | 1995 Honda Accord | 2017 GMC Sierra |
| 1995 Nissan PK | ||
| 7 | 1999 Honda Civic | 2004 Chevrolet Silverado |
| 8 | 1994 Honda Accord | 1998 Honda CRV |
| 9 | 1995 Honda Civic | 1997 Jeep RNG |
| 2017 GMC SAV | ||
| 1997 Honda CRV | ||
| 10 | 1996 Honda Civic | 2006 Ford F250 |
| 1988 Toyota PK |
Speaking of the District Attorney, as of June 2019, the office announced the end of one of the biggest auto theft schemes in San Diego County history:
Safest Neighborhoods in San Diego
There’s no other way to put it — knowing that your neighborhood is considered safe is really important.
We checked in with Neighborhood Scout, which provides national Crime Risk Data in the following categories: Total Crime Risk, Violent Crime Risk, Property Crime Risk, Murder, Rape, Robbery, Assault, Burglary, Theft, and Motor Vehicle Theft.
First, we examined the group’s list of the Top 10 Safest San Deigo Neighborhoods:
- Alameda Blvd / Palm Ave
- Highland Valley Rd / Sycamore Creek Rd
- Darkwood Rd / Park Run Rd
- Kika Ct / Mercy Rd
- Via Cuesta Verde / Circa Oriente
- Alliant International U / Pomerado Rd
- Santo Rd / Shields St
- Loire Ave / Riesling Dr
- Mira Mesa Blvd / Aderman Ave
- W Bernardo Dr / Aguamiel Rd
Violent Crime Comparisons Per 1,000 Residents
From there, we wanted to provide a closer look at crime in San Diego. In comparing violent crime per 1,000 residents in San Diego to the rest of California, the rate in San Diego is lower at 3.72, versus 4.49.
The chances of becoming a victim of violent crime in San Diego is also lower than that of the state — one out of 268 in San Diego, versus one out of 223 in all of California.
Finally, San Diego’s Crime Index is 27 (with 100 being the safest), meaning San Diego is safer than 27 percent of all US cities.
Here’s a breakdown of the city’s annual crime rates, including those categorized as “violent” crimes and “property” crimes:
San Diego Annual Crimes
| San Diego Annual Crimes | Violent | Property | Total |
|---|---|---|---|
| Number of Crimes | 5,287 | 27,397 | 32,684 |
| Crime Rate (per 1,000 residents) | 3.72 | 19.3 | 23.02 |
Traffic
Bumper-to-bumper roads, standstill speeds, and constant frustration.
Newsflash — no one enjoys sitting in traffic.
A general rule of thumb is that the bigger the city, the more traffic motorists can expect. And with over 1.4 million residents, you can guarantee that San Diego drivers know their fair share of traffic headaches.
Traffic Congestion in San Diego
The INRIX 2018 Global Traffic Scorecard claims to be “the most in-depth congestion and mobility study of its kind,” studying trends in six continents, 38 countries and more than 200 cities. San Diego makes this list, at a ranking of 184. San Diego, however, is not as highly-ranked as other California cities like Los Angeles (#47), San Francisco (#65), or Sacramento (#156).
San Diego Traffc INRIX
| Rank | Hours Lost in Congestion | Percent Change from Previous Year (+/-) | Cost of Congestion Per Driver |
|---|---|---|---|
| 184 | 56 | -14% | $781 |
According to these stats, San Diego drivers lost about 2.3 days’ worth of time stuck in traffic, at $781 per driver.
– Transportation
All of this “traffic talk” naturally leads us to look at the average commute times of San Diego drivers.
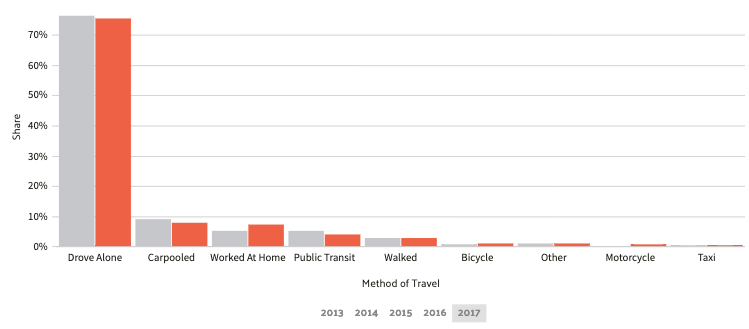
Data USA reports that San Diego drivers generally have a shorter commute time than the typical U.S. worker, at 22.9 minutes (compared to 25.5 minutes). We also learned that 1.94 percent of San Diego’s workforce has “super commutes” of over 90 minutes. The graph below compares San Diego commute averages (in orange) to the rest of the nation:
Finally, when it comes to whether San Diego drivers prefer to drive alone or carpool, the results are overwhelming, showing 75.4 percent of drivers ride alone.
Busiest Highways
To gain more insight into the size of San Diego’s highways, we turn to the U.S. Department of Transportation’s Federal Highway Administration.
Three San Diego interstates have made the administration’s list of highways with the most lanes:
San Diego Highways with Most Lanes
| San Diego Highway | Number of Lanes |
|---|---|
| I-8 | 12 |
| I-15 | 12 |
| I-805 | 12 |
Keep in mind that the number of lanes represents the total number of lanes in both directions for multi-directional roads (for instance, northbound and southbound). These figures do not include toll plazas.
How Safe Are San Diego’s Streets and Roads?
From car crashes to pedestrian fatalities — we are now taking a closer look at just how safe San Diego’s streets and roads are.
To do this, we’re dissecting data provided by the National Highway Traffic Safety Administration (NHTSA), and breaking them down by the categories that matter the most to you.
First, we’re looking at the number of fatalities in San Diego County. The data reveals that from 2015 to 2017, the numbers are going down:
San Diego County Fatalities
| San Diego County | 2013 | 2014 | 2015 | 2016 | 2017 |
|---|---|---|---|---|---|
| Fatalities | 198 | 233 | 246 | 243 | 231 |
Next, we examine fatalities in crashes involving an alcohol-impaired driver (BAC = .08+). In addition to seeing a significant increase from 2014 to 2015, we see the numbers remain higher in 2016 and 2017 (in spite of a slight decrease in the latter years):
San Diego Alcohol-Impaired Driver Fatalities
| San Diego County | 2013 | 2014 | 2015 | 2016 | 2017 |
|---|---|---|---|---|---|
| Fatalities | 54 | 55 | 71 | 83 | 78 |
As for single-vehicle crash fatalities, the overall data from 2013 to 2017 reveals widespread fluctuation, with fatalities going both up and down during the period:
San Diego Single Vehicle Fatalities
| San Diego County | 2013 | 2014 | 2015 | 2016 | 2017 |
|---|---|---|---|---|---|
| Fatalities | 122 | 152 | 149 | 151 | 145 |
When it comes to fatalities in crashes that involve speeding, we see a troubling trend in San Diego county — a consistent increase from year-to-year:
San Diego Speeding Crash Fatalities
| San Diego County | 2013 | 2014 | 2015 | 2016 | 2017 |
|---|---|---|---|---|---|
| Fatalities | 67 | 71 | 75 | 76 | 78 |
An upward trend can also be seen in the number of crash fatalities involving roadway departures, specifically between 2014 and 2016:
San Diego Fatalities Roadway Deparuture
| San Diego County | 2013 | 2014 | 2015 | 2016 | 2017 |
|---|---|---|---|---|---|
| Fatalities | 90 | 88 | 102 | 106 | 103 |
With fatalities in crashes involving an intersection (or that were intersection-related), we see a decline going from 2016 to 2017:
San Diego Fatalities in Crashes Involving an Intersection
| San Diego County | 2013 | 2014 | 2015 | 2016 | 2017 |
|---|---|---|---|---|---|
| Fatalities | 43 | 51 | 49 | 50 | 35 |
With passenger car occupant fatalities, we see a decrease in 2017. This comes out of two years of identical stats.
San Diego Passenger Car Occupant Fatalities
| San Diego County | 2013 | 2014 | 2015 | 2016 | 2017 |
|---|---|---|---|---|---|
| Fatalities | 61 | 60 | 77 | 77 | 61 |
When it comes to pedestrian fatalities in San Diego County, we see slight decreases year-to-year from 2015 to 2017. However, a 2017 report by the Governors Highway Safety Association ranked San Diego as the 7th-highest in the country for pedestrian deaths.
San Diego Pedestrian Fatalities
| San Diego County | 2013 | 2014 | 2015 | 2016 | 2017 |
|---|---|---|---|---|---|
| Fatalities | 54 | 77 | 74 | 73 | 70 |
Since 2014, pedalcyclist deaths have been on the decline in San Diego County:
San Diego Pedalcyclist Fatalities
| San Diego County | 2013 | 2014 | 2015 | 2016 | 2017 |
|---|---|---|---|---|---|
| Fatalities | 5 | 10 | 6 | 5 | 3 |
The NHTSA’s Fatality Analysis Reporting System (FARS) provides us with data comparing fatalities on a variety of road types in San Diego and California in general.
Here are some basic definitions to help you navigate this data:
- An arterial road is designed for large amounts of traffic, like highways.
- Roads known as minor arterials link cities, towns, and geographical areas.
- A collector road in urban areas “collects” local traffic and bring it to arterial roads. In rural areas, collector roads serve as intra-county connections.
San Diego Fatal Crashes by STATE and Road Function Class
| Road Type | Fatalities in San Diego County | Fatalities in California |
|---|---|---|
| Rural Interstate | 7 | 135 |
| Urban Interstate | 41 | 296 |
| Freeway and Expressway | 38 | 459 |
| Other | 30 | 972 |
| Minor Arterial | 45 | 685 |
| Collector Arterial | 45 | 480 |
| Local | 9 | 271 |
| Unknown | 0 | 6 |
| Total | 215 | 3,304 |
In all, San Diego saw 215 fatal crashes of California’s 3,304.
Finally, here’s a look at railroad crash data provided by the U.S. Department of Transportation:
San Diego US DOT Railroad Crossing Incident
| Highway User Speed | Calendar Year | Highway | Highway User Type | Rail Equipment Type | Non-Suicide Fatality | Non-Suicide Injury |
|---|---|---|---|---|---|---|
| 2012 | PALM ST | Pedestrian | B | 1 | 0 | |
| 15 | 2012 | 26TH AND COMMERCIAL | Automobile | Psgr Train | 0 | 0 |
| 15 | 2012 | 16TH & COMMERCIAL ST | Automobile | Psgr Train | 0 | 0 |
| 0 | 2012 | NAPLES STREET | Pedestrian | Psgr Train | 0 | 0 |
| 2012 | WASHINGTON ST | Pedestrian | B | 1 | 0 | |
| 0 | 2012 | WASHINGTON STREET | Truck-trailer | C | 0 | 7 |
| 2012 | CARLSBAD VILLAGE DR | Pedestrian | Psgr Train | 1 | 0 | |
| 30 | 2012 | 28TH AND COMMERCIAL | Automobile | Psgr Train | 0 | 0 |
| 0 | 2012 | CHESTERFIELD DR | Truck-trailer | Psgr Train | 1 | 5 |
| 3 | 2012 | COMMERCIAL STREET | Automobile | Psgr Train | 0 | 1 |
| 10 | 2012 | IRIS AVENUE | Automobile | Psgr Train | 0 | 0 |
| 2013 | MISSION AVE | Pedestrian | Freight Train | 1 | 0 | |
| 0 | 2013 | SORRENTO VALLEY BLVD | Automobile | Commuter | 0 | 0 |
| 2013 | CARLSBAD PEDESTRIAN | Pedestrian | Psgr Train | 1 | 0 | |
| 2013 | MISSION AVE | Pedestrian | Freight Train | 0 | 1 | |
| 2013 | GRAND AVE | Pedestrian | B | 0 | 1 | |
| 0 | 2013 | CASSIDY STREET | Pedestrian | Commuter | 0 | 0 |
| 0 | 2013 | HAWTHORN | Automobile | C | 0 | 0 |
| 0 | 2013 | GRAPE ST | Automobile | Psgr Train | 0 | 0 |
| 2013 | CIVIC CENTER DRIVE | Pedestrian | Commuter | 0 | 0 | |
| 2014 | HAWTHORNE ST | Pedestrian | Psgr Train | 1 | 0 | |
| 2014 | GRAND AVE | Pedestrian | Freight Train | 1 | 0 | |
| 2014 | UNIVERSITY AVENUE | Pedestrian | Psgr Train | 0 | 1 | |
| 0 | 2014 | WEST PARK AVENUE | Pedestrian | Psgr Train | 1 | 0 |
| 0 | 2015 | CASSIDY ST | Automobile | Psgr Train | 0 | 1 |
| 0 | 2015 | COAST BLVD | Pedestrian | B | 0 | 0 |
| 2015 | MARKET ST | Pedestrian | Freight Train | 1 | 0 | |
| 25 | 2015 | PALM ST | Automobile | B | 0 | 0 |
| 0 | 2015 | WASHINGTON STREET | Pedestrian | C | 0 | 0 |
| 2015 | COMMERCIAL STREET | Pedestrian | Psgr Train | 0 | 0 | |
| 10 | 2015 | COMMERCIAL | Automobile | Psgr Train | 0 | 0 |
| 25 | 2016 | COMMERCIAL | Automobile | Psgr Train | 0 | 0 |
| 5 | 2016 | PRIVATE | Truck-trailer | Yard/Switch | 0 | 0 |
| 2016 | LAS POSAS ROAD | Pedestrian | E | 0 | 0 |
Allstate’s America’s Best Drivers Report
If you’ve ever asked yourself whether San Diego drivers rank among the nation’s best or worst, Allstate has you covered.
Thanks to the provider’s annual “America’s Best Drivers” Report, we gain a better insight into how San Diego drivers compare to those across the United States.
Here’s the bottom line — out of 200 cities, San Diego received a 119th-place ranking in 2019, which is down three spots from its 116th place ranking in 2018.
Here are some more stats we pulled from the report:
San Diego - America's Best Drivers Report 2019
| Allstate America's Best Drivers Report® 2019 | Stats |
|---|---|
| 2019 Best Drivers Report Ranking | 119 |
| Average Years Between Collisions | 8.48 |
| 2018 Best Drivers Report Ranking | 116 |
| Change from 2018 | -3 |
| Relative Collision Likelihood | 24.70% |
| Drivewise® HardBraking Events per 1,000 Miles | N/A |
Another noticeable standout? The likelihood of a San Diego driver getting into a collision is 24.7 percent.
Ridesharing in San Diego
We know that ridesharing services are surging in popularity — not only among passengers looking to save but also among drivers looking to supplement their income.
We went to RideGuru to see what rideshare services are available in San Diego:
- Bounce
- Lyft
- Uber
- Taxi
In plugging in different destinations on the site, we found that in many cases, ridesharing services were less expensive than traditional taxis. Prices will undoubtedly vary from destination to destination, so it’s important to always compare prices
E-star Repair Shops
As if getting in a car accident wasn’t bad enough, trying to figure out where to get your vehicle repaired can also prove to be challenging.
With the Esurance E-star Direct Repair Program, San Diego drivers can view a list of shops regarded as high-quality and highly-rated.
We gathered a list of the top 10 E-star Network repair shops in San Diego:
San Diego Top 10 EStar Repair
| Address | Contact | |
|---|---|---|
| SE COLLISION | 2175 HANCOCK STREET SAN DIEGO CA 92110 | email: [email protected] P: (619) 260-1167 |
| CARRILLO AND SONS COLLISION CENTER | 4680 OLD CLIFFS ROAD SAN DIEGO CA 92101 | email: [email protected] P: (619) 287-7200 |
| ALL-AMERICAN PAINT & BODY, INC. | 8315 BUCKHORN ST SAN DIEGO CA 92111 | email: [email protected] P: (858) 467-0700 F: (858) 541-1101 |
| CALIFORNIA AUTO BODY | 1921 ROOSEVELT AVE NATIONAL CITY CA 91950 | NATIONAL CITY CA 91950 email: [email protected] P: (619) 477-9141 F: (619) 477-8253 |
| CALIBER - SAN DIEGO - MIRAMAR | 6598 MIRAMAR RD SAN DIEGO CA 92121 | SAN DIEGO CA 92121 email: [email protected] P: (858) 453-3800 F: (972) 906-7164 |
| ELITE AUTO COLLISION REPAIR CENTER | 4949 BALTIMORE DR LA MESA CA 91941 | email: [email protected] P: (619) 667-3788 F: (619) 667-3981 |
| PHILIP THEARLE'S AUTOWERKS, INC. | 8809 MISSION GORGE ROAD SANTEE CA 92071 | email: [email protected] P: (619) 449-0111 F: (619) 562-8009 |
| ABX COLLISION CENTERS, INC. | 11875 SORRENTO VALLEY ROAD SAN DIEGO CA 92121 | email: [email protected] P: (858) 486-4476 F: (858) 486-1706 |
| FIX AUTO CHULA VISTA | 2285 MANYA ST SAN DIEGO CA 92154 | email: [email protected] P: (619) 429-7800 F: (619) 628-1570 |
| TORREY PINES COLLISION | 11633 SORRENTO VALLEY ROAD SAN DIEGO CA 92121 | email: [email protected] P: (858) 350-0397 |
Weather in San Diego
It’s called “Sunny California” for a reason. And in the city of San Diego, mild temperatures and a mild climate are the norm.
In looking at the U.S. Climate Data for San Diego, we can see the results are pleasant, to say the least:
San Diego Weather Averages
| San Diego Weather | Average |
|---|---|
| Annual High Temperature | 69.8°F |
| Annual Low Temperature | 57.5°F |
| Average Temperature | 63.65°F |
| Average Annual Precipitation - Rainfall | 10.4 inches |
| Days per Year with Precipitation - Rainfall | 43 days |
| Annual Hours of Sunshine | 2958 hours |
| Average Annual Snowfall | N/A |
Beautiful weather aside, San Diego has had its occasional share of natural disasters. According to City-Data.com, San Diego County has seen a total of 35 natural disasters, including fires (19), floods (15), storms (9) and landslides (5).
Information like this serves as a reminder of the importance of comprehensive car insurance coverage, which addresses the damage your car may sustain in unpredictable weather events.
Public Transit in San Diego
Buses, trains, and trolleys — public transportation is alive and well in the city of San Diego. In fact,
The city’s Metropolitan Transit System (MTS) serves 88 million annually, or 300,000 trips each week.
We’ve compiled a table highlighting rates across various forms of MTS:
San Diego MTS Rates
| Type of Transportation | Adult/Youth Rate | Senior/ Disabled/ Medicare Rate |
|---|---|---|
| MTS Trolley | $2.50 | $1.25 |
| MTS Bus | $2.25 | $1.10 |
| MTS Rapid (Route 215) | $2.25 | $1.10 |
| MTS Rapid (Routes 225, 235, 237) | $2.50 | $1.25 |
| MTS Express (Routes 20, 50, 60, 110, 150, 870, 950) | $2.50 | $1.25 |
| MTS Rapid Express/Premium (Routes 280, 290) | $5 | $2.50 |
| MTS Rural (Routes 888, 891, 892, 894) | 1 zone: $5 2 zones: $10 | 1 zone: $2.50 2 zones: $5 |
| MTS Sorrento Valley COASTER Connection (Routes 972, 973, 978, 979) | Free | Free |
| MTS Access (ADA Paratransit) | — | $4.50 |
Passengers who ride more frequently can also purchase passes, which range in price from $5 a day to $165 monthly. To get a complete breakdown of pass rates, click here.
Alternate Transportation
For the San Diego resident looking to explore other modes of transportation, like bikes and scooters, you’ve got options.
Rent-a-bike and rent-a-scooter services like Lime and Bird are available to San Diego residents.
Renters are typically charged with an initial unlocking fee, then charged by-the-minute. Both are activated by apps, which you can download in the Apple App Store or Google Play.
Parking in Metro Areas
Let’s be honest — whether you’re looking to park in the street or use a metered space, parking in metro areas can be challenging, especially in larger cities like San Diego.
Here’s what you need to know about metered parking in San Diego:
- The city manages 5,700 metered parking spaces.
- The majority of parking meters are enforced Monday through Saturday, from 8 a.m. until 6 p.m.
- However, meters within the Hospitality Zone in Downtown or Hillcrest Commercial Zone in Hillcrest operate until 8 p.m.
- Meters can be paid by coin, credit card (Visa, Mastercard, and Discover), by mobile phone (only with meters displaying a green Parkmobile app sticker), or by Near Field Communication (NFC) payments such as Apple Pay, Android Pay, and Samsung Pay on certain enabled meters.
We learned that parking in San Diego can be so challenging, some are renting out spots as a way of making some extra money:
Parking garages are also an option in downtown San Diego. Head to this site to learn more about parking garages available in the Gaslamp Quarter.
Air Quality in San Diego
To the experts, it’s pretty simple — “dirty cars, dirty air.” Vehicles have a significant impact on the air quality of any city, including San Diego. According to the Union of Concerned Scientists:
“Cars, trucks, and buses powered by fossil fuels are major contributors to air pollution—transportation emits more than half of nitrogen oxides in our air, and is a major source of global warming emissions in the US. Studies have linked pollutants from vehicle exhaust to adverse impacts on nearly every organ system in the body.”
So, what can be said about the air quality in San Diego? We looked at stats from the United States Environmental Protection Agency:
San Diego Air Quality Report
| Air Quality in San Diego - Carlsbad | 2018 | 2017 | 2016 |
|---|---|---|---|
| Days with Air Quality Index | 365 | 365 | 366 |
| Good Days | 73 | 83 | 69 |
| Moderate Days | 257 | 220 | 255 |
| Days Unhealthy for Sensitive Groups | 35 | 56 | 40 |
| Days Unhealthy | n/a | 6 | 2 |
| Days Very Unhealthy | n/a | n/a | n/a |
These stats show that it has been rare for the city to have unhealthy days — so much so, there were none registered in 2018. However, for those who are considered sensitive, that number has fluctuated over the years.
Military Veterans
The military is an important and significant part of the San Diego community. The San Diego Military Advisory Council reports:
Approximately 140,000 Active Duty and civilian employees of the Navy, US Marine Corps (USMC), Coast Guard, and VA together with Reserves of all branches of service worked in San Diego County during FY 2017.
San Diego drivers with ties to the military will undoubtedly want to know what their options are — namely, if they qualify for special discounts or rates. For more information, see car insurance discounts for military members for all the details.
– Veterans in San Diego
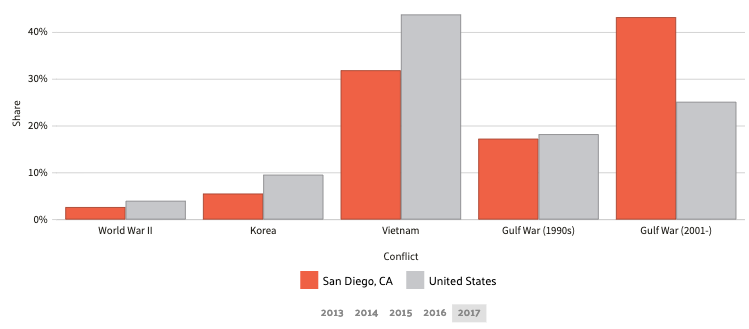
In looking at where military personnel living in San Diego have served, Data USA reports that the largest group can be tied to the Gulf War, at 29,651 people. The second-largest group can be found in the 21,852 who served in Vietnam.
Military Bases in San Diego
With the city’s large military population comes an impressive number of local bases, including:
- Marine Corps Air Station Miramar
- Marine Corps Case Camp Pendleton
- Marine Corps Recruit Depot San Diego
- Naval Base Coronado
- Naval Base Point Loma
- Naval Base San Diego
- U.S. Coast Guard Station San Diego
Military Discounts by Provider
Knowing which providers offer members of San Diego’s military community car insurance discounts is key, and we want to make getting that information easy.
We’ve compiled a table below letting you know which of the city’s largest insurance providers offer a military discount:
San Diego Military Discounts
| Insurance Company | Military Discount Available |
|---|---|
| n/a | |
| yes | |
| yes | |
 | yes |
| n/a | |
| n/a | |
| yes | |
 | n/a |
| yes |
USAA Availability in California
In the world of car insurance, no other company is as closely tied to the military as USAA car insurance. We wanted to compare USAA’s rates to other large providers in California.
What we found was simple — USAA not only had the lowest average rate on this list, but it is also nearly a thousand dollars below the state’s average.
San Diego USAA vs the rest
| Insurance Provider | Average Rate | Higher/Lower than State Average | Percentage Above/Below State Average |
|---|---|---|---|
| $2,693.87 | -$995.06 | -26.97% | |
| $2,849.67 | -$839.26 | -22.75% | |
| $2,885.65 | -$803.28 | -21.78% | |
 | $3,034.42 | -$654.51 | -17.74% |
| $3,349.54 | -$339.39 | -9.20% | |
| $4,202.28 | $513.35 | 13.92% | |
| $4,532.96 | $844.03 | 22.88% | |
 | $4,653.19 | $964.26 | 26.14% |
| $4,998.78 | $1,309.85 | 35.51% |
Unique City Laws
Here’s what every driver needs to know — the laws that regulate your roads vary from state to state, and sometimes, from city to city.
But where staying up-to-date on San Diego’s rules of the road may seem intimidating, you don’t have to worry — we’ve done all of the hard work for you.
In this final section of our comprehensive guide, we’re taking a look at all of the need-to-know laws unique to San Diego, and to California.
New Driving Laws
First, let’s talk about some new laws that went into effect in the state of California, effective January 2019. According to the Department of Motor Vehicles, here are some changes you can expect:
- Driving Under the Influence – Ignition Interlock Device: From January 1, 2019, to January 1, 2026, this law mandates repeat offenders for driving under the influence (DUI) and first DUI offenders whose violations resulted in injury, to install an ignition interlock device (IID) for a period ranging from 12 to 48 months.
- Driving Privilege for Minors: This law repeals a juvenile court’s authority to suspend, restrict, or delay the issuance of a driver’s license of a habitual truant or ward of the state for up to one year.
For a full list of new laws, click here.
Cell Phones and Driving in San Diego
When it comes to the use of cell phones while on the road, the law is straightforward:
- California bans all drivers from using handheld cellphones while driving. There are exceptions for certain emergencies.
- Drivers ages 18 and up can use hands-free phones with earpieces, as long as pieces are not found in both ears.
- Texting while driving is prohibited.
San Diego Parking Laws
Where can San Diego drivers legally park? And, what’s the deal with “wheel cramping”? Here’s a rundown of some of San Diego’s most important parking laws:
- No vehicle may be parked continuously at one location on any public roadway for more than 72 hours.
- Parking is prohibited in alleys, except to actively unload goods or passengers, or if the alley has been designated as a parking zone.
- Wheel cramping (i.e., turning your wheels toward the curb when you park) is required on all grades over 3% (hills) with or without the presence of signs.
- Officials go on to say drivers should: “block your wheels diagonally against the curb by turning your wheels into the curb when facing downhill and out to the street when facing uphill.”
- Parking is prohibited in the following places:
- in an intersection or a crosswalk;
- within 15 feet of a fire station driveway or fire hydrant
- on a sidewalk or parkway;
- on the roadway side of a parked vehicle (double parking);
- in a bus stop;
- in a tunnel;
- upon a bridge (unless otherwise posted);
- in such a manner that obstructs the free use of the street;
- in a center median strip unless signs are posted permitting parking on the median; and
- in front of a public or private driveway (even your driveway)
For a complete listing of parking rules and regulations, click here.
Food Trucks in San Diego
Given the popularity of food trucks, drivers may be curious to know what kind of regulations the city has in place. Some high points of the local law include:
- Mobile Food Trucks operating in the city MUST have a permit.
- Mobile food trucks are permitted in a majority of downtown, but approval may be required in certain areas.
- Specific documents and plans MUST be submitted to the city ahead of time.
You’ll also want to check what insurance is required for a food truck in California, too.
To review all of the requirements, click here.
Free Car Insurance Comparison
Enter your ZIP code below to view companies that have cheap car insurance rates.
Secured with SHA-256 Encryption
San Diego Car Insurance FAQs
Do you still have some lingering questions about living and driving in San Diego? We figured as much — that’s why we’ve assembled this list of Frequently Asked Questions.
How Do I Get a San Diego Driver’s License?
If you are new to San Diego but coming from another California city, your state license will still be valid. You will, however, want to complete a change of address form. Depending on your circumstances, this may or may not require a visit to your local DMV. You can learn more about the process here.
If you are moving to San Diego as a new California resident, you must get a California driver’s license within ten days. According to state officials, “residency is established by voting in a California election, paying resident tuition, filing for a homeowner’s property tax exemption, or any other privilege or benefit not ordinarily extended to nonresidents.”
If you are over 18 and getting a California license for the first time, you’ll need to follow some important steps, starting with filling out an application. See the full list of requirements here.
How Long Does It Take to Drive From Place to Place in San Diego?
While drive times will vary by time of day and location, the San Diego Tourism Authority provides these estimates from downtown:
- Anza-Borrego Desert State Park – 2 hours
- Coronado – 7 minutes
- Escondido – 30 minutes
- Hotel Circle – 10 minutes
- Julian – 90 minutes
- La Jolla – 20 minutes
- Mission Bay – 15 minutes
- Oceanside – 45 minutes
- San Diego International Airport (Lindbergh Field) – 10 minutes
- Tijuana – 30 minutes
- Ensenada – 2 hours
- Rosarito – 1 hour
Do I Need a Car in San Diego?
Whether you need a car will ultimately depend on where you live and work. But remember, public transportation is an option. You can begin to explore routes and schedules by visiting the Metropolitan Transit System website.
Is Living in San Diego Expensive?
The state of California is known for its higher-than-normal living expenses, and the same can be said of San Diego. According to Payscale.com, the cost of living in San Diego is 44 percent higher than the national average. The website also reports that San Diego’s housing expenses are 136% higher than the national average. Whether you can afford to live in San Diego will largely depend on your income, as well as other day-to-day factors such as utilities and transportation.
You’ve officially reached the end of our complete guide to car insurance in San Diego. Now is the time to begin shopping around for the best car insurance rates. Comparing is easy — just enter your zip code into our free comparison tool now.
Frequently Asked Questions
How are car insurance rates determined in San Diego, CA?
Car insurance rates in San Diego, CA are determined by several factors, including your age, driving history, type of vehicle, location, coverage levels, and insurance provider. These factors help insurers assess the level of risk associated with insuring you and your vehicle.
Are car insurance rates higher in San Diego compared to other areas?
Car insurance rates can vary between different locations. While San Diego, CA, is known for having relatively higher insurance rates compared to some other areas, it’s essential to consider that rates can vary significantly based on individual circumstances and the specific insurance company you choose.
What are some factors that can affect my car insurance rates in San Diego, CA?
Factors that can affect your car insurance rates in San Diego, CA, include your driving record, age, gender, marital status, credit history, type of vehicle, the number of miles you drive annually, your coverage limits, and any previous claims or accidents.
Are there any discounts available to lower car insurance rates in San Diego, CA?
Yes, many insurance companies offer various discounts to help lower car insurance rates. Some common discounts include safe driving discounts, multi-policy discounts, multi-vehicle discounts, good student discounts, and discounts for completing defensive driving courses. It’s recommended to check with different insurance providers to see which discounts you may be eligible for.
Are there any specific requirements for car insurance coverage in San Diego, CA?
In California, including San Diego, all drivers are required to have a minimum amount of liability insurance coverage. The current minimum requirements in California are $15,000 for bodily injury per person, $30,000 for bodily injury per accident, and $5,000 for property damage.
Free Car Insurance Comparison
Enter your ZIP code below to view companies that have cheap car insurance rates.
Secured with SHA-256 Encryption
Tracey L. Wells
Licensed Insurance Agent & Agency Owner
Tracey L. Wells is a licensed insurance agent and Farmers insurance agency owner with 23 years of experience. He is proud to be a local Farmers agent serving Grayson, Georgia and surrounding areas. With experience as both an underwriter and agent, he provides his customers with insight that others agents may not have. His agency offers all lines of insurance including home, life, auto, RV, busi...
Licensed Insurance Agent & Agency Owner
Editorial Guidelines: We are a free online resource for anyone interested in learning more about auto insurance. Our goal is to be an objective, third-party resource for everything auto insurance related. We update our site regularly, and all content is reviewed by auto insurance experts.


